Reporting
Different Types of Reports Available in Salesforce
- Tabular (no grouping)
- Summary (grouped by rows)
- Matrix (grouped by rows and columns)
- Joined (report blocks that provide different views of your data)
Reporting over Aggregate Data
To display aggregated data, you can use a custom object to represent the incrementation/summary. If this solution isn't feasible, it's recommended to utilize "Tableau/CRM Analytics" and employ a "Recipe."
Displaying a Map
There are three options: - AppExchange - LWC with Apex Controller - Tableau/CRM Analytics (Map is available out-of-the-box)
Reporting over LDV Objects
When reporting over LDV records, consider the 10-minute timeout limit. As a best practice, use Tableau/CRM Analytics to report over LDV objects.
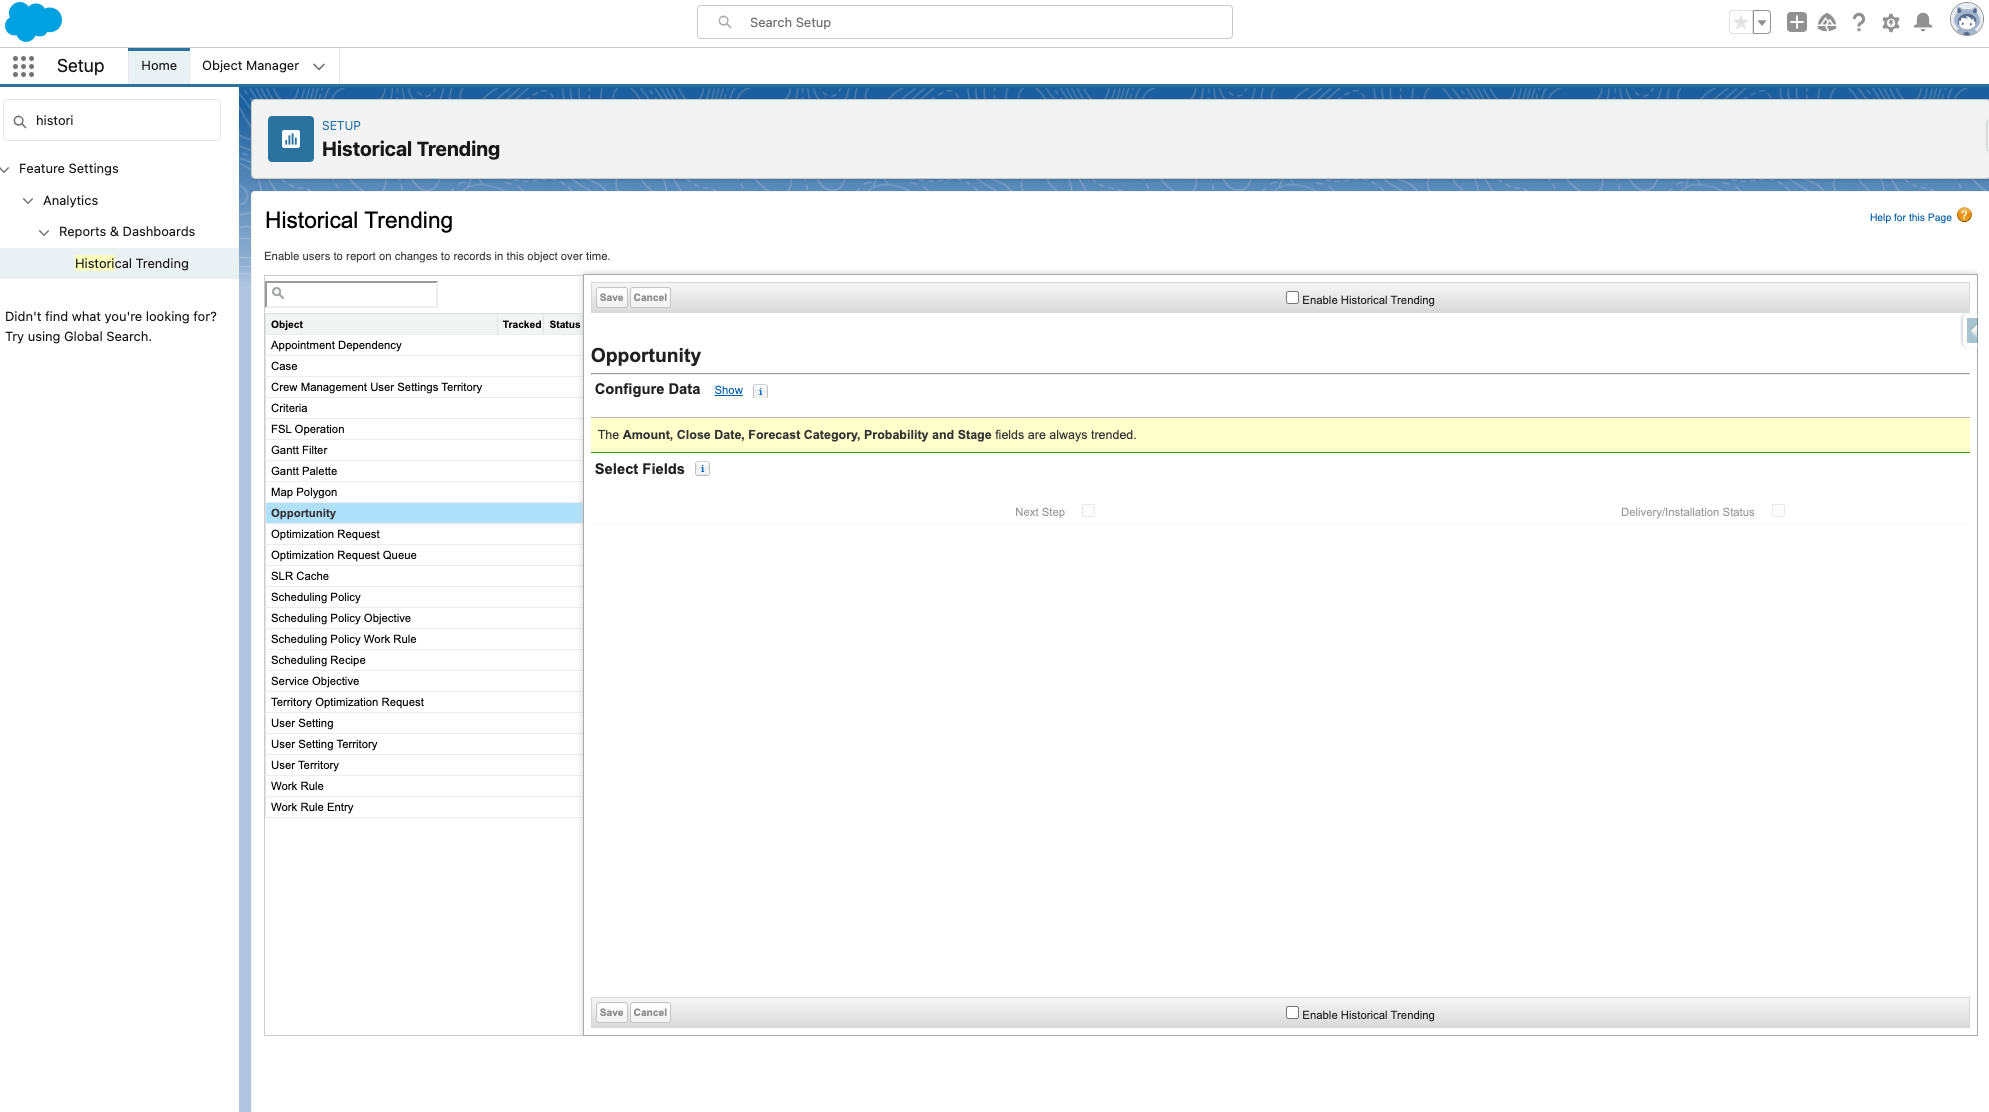
Historical Trend Reporting (Historical Tracking Reports)
Historical trend reporting uses a special custom report type designed to highlight changes between five snapshot dates, such as five business days or five business weeks. Visual representations of data changes can be depicted in charts and on dashboards.
Historical tracking must be enabled for each object (including the fields) that you want to track.
Snapshots
Reporting snapshots enable loading data from a custom report to a custom object on a regular schedule. This functionality allows working with report data similar to other records in Salesforce.
Performance
Improving Report Performances
- Use Filters to remove unnecessary data.
- Remove unused columns, etc.
- Write Efficient Formulas.
- Optimize Sharing rules.
- Hard Delete Reports (Records stay 1 month in the bin).
- Run reports during Off-peak hours.
Limitations
- Reports can
only display 2k rows. - Time-out after 10 min.
- Historical Tracking limitations:
- Salesforce retains historical data for the
previous 3 months + the current month. - Maximum 5M rows can be stored for historical data.
- Historical Trend Reports can't be exported.
- Salesforce retains historical data for the